
Cara Thompson is a Data Visualisation Consultant on a mission to help people make better graphs, which spark conversation and are memorable. This article gives you 10 tips on how to use text better in data visualisation, with some notes on implementing these in R with ggplot2. Check out her session here. This is part of our Data Visualisation training course, find out more below.
The ability to visualise information effectively is a critical skill for professionals across all industries. Visual representations of data enable quicker interpretation, allowing decision-makers to act on insights promptly. By providing a clear picture of the data, visualisations help in making informed and evidence-based decisions, by allowing key decision-makers to get to grips with the main patterns in the data.
Clear data visualisations are a great asset in communicating with diverse audiences with different levels of data literacy and expertise in the topic under discussion. They make it easier to share insights and findings with stakeholders, colleagues, and clients, ensuring everyone is on the same page.
Predicted by Sound Properties
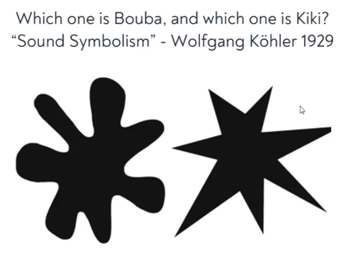
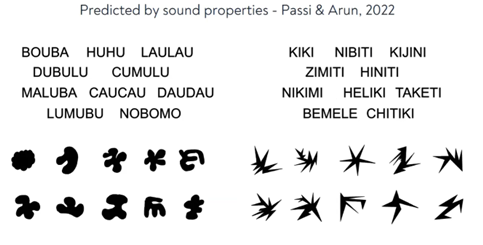
- Decrease reliance on text: Before adding text to your visualisation, first consider whether you need it! If you do, how can you make it easier for people to remember what is what without needing to read the text? Cara suggests clever uses of colour to help make the plots as intuitive as possible and thereby decrease reliance on text.
- Add Text Hierarchy (Google Fonts): Establishing a clear text hierarchy helps direct the viewer’s focus to the most important information first. Utilise different font weights, sizes, and shades of colour to differentiate between titles, subtitles, labels, and annotations. Tools like Google Fonts offer a wide range of typefaces that can help you create a visual hierarchy that supports the narrative of your data.

- Reduce Unnecessary Eye Movement: To make your visualisations more intuitive, position text in a way that minimises the need for the viewer to move their eyes excessively. Labels should be placed as close as possible to the data points they refer to, and important information should be grouped together to ensure a smooth reading experience.
- Declutter, Declutter, Declutter: Simplicity is key in effective data visualisation. Remove any unnecessary text or elements that don’t contribute directly to the understanding of the data. Overloading a chart with too much information can overwhelm the viewer and obscure the key message. Aim for clarity by keeping your text concise and your design clean.
- Tie Your Text to Data: If you are using annotations, consider whether you can copy the colour they relate to in the text. Be careful to check this doesn’t compromise on accessibility (the contrast between text and background needs to be strong enough to be legible). If you have multiple annotations about different elements in the plot, this can help reduce confusion about what belongs to what.
- Don’t Neglect Tables: While graphs and charts are powerful tools for visualising data, tables can also be highly effective, especially when precise values are important. Make sure that the text in your tables is as carefully considered as in your graphs—use clear headers, consistent formatting, and align text to make the information easily digestible.
- Signpost Additional Information: Sometimes, your visualisation might require additional explanation or context that doesn’t fit within the graph or chart itself. Use footnotes, captions, or callouts to signpost this information without cluttering the main visual. This approach allows you to provide necessary detail while keeping the primary visual clean and focused. You can also consider creating an interactive visualisation in which more information is available on demand.
- Manipulate Text in Tibbles: When working with data in tools like R, you can create your text programmatically, straight from the data. There are a few tricks involved in getting this right (see this post for more details). This avoids needing to redo all your labels by hand when the next piece of data becomes available!
- Optimise Text Functionality:Always make sure to choose a font that is easy to read – but that doesn’t mean it has to have no personality! Choose fonts which are easy to read in smaller print. And if you need a smaller font, say, in a tooltip, consider adding a bit of extra spacing between letters to make it easier to read.
- Give Everything Space to Breathe: White space, or negative space, is a critical element in design that also applies to text in visualisations. Adequate spacing around text, and around the graph as a whole, turns the visualisation from something that looks very information-dense to something much more appealing to engage with!
These tips collectively enhance the clarity and impact of your data visualisations, ensuring that your audience can easily interpret and engage with the information you present.

This immersive training course is designed to help you turn complex data into clear, insightful, and actionable visual representations. Whether you are a data analyst, business intelligence professional, manager, or marketer, this course will empower you to communicate your data stories compellingly and effectively.

Cara Thompson,
Data Visualisation Consultant
Meet the Trainer
Cara Thompson is a data visualisation consultant with an academic background, known for her expertise in transforming complex data into clear, compelling visualisations. She specialises in helping research teams and data-driven organisations enhance their data-to-visualisation workflow through clear guidelines and repeatable processes. Aside from equipping others to build polished versions of “normal graphs”, Cara enjoys crafting more artistic visual responses to data patterns, showcased in her online portfolio. As a regular contributor to workshops, conferences, and online platforms, she is passionate about sharing dataviz tips and helping others enhance their skills through talks, bespoke training, and one-on-one coaching.